Overview
The Reporting section in Adgentek gives you full visibility into your campaign performance. You can access real-time dashboards with built-in reports, build custom reports tailored to your specific needs, and schedule automated report delivery to your inbox. The Reporting section is located in the left-hand navigation menu and contains three sub-sections: Built-in Reports, Report Builder, and Report Manager.
Built-in Reports
Built-in Reports provide an at-a-glance overview of your advertising performance across all campaigns. This is the default view when you navigate to the Reporting section.
Accessing Built-in Reports
- Click Reporting in the left navigation menu.
- Select Built-in Reports from the submenu.
- The dashboard will load with your performance data for the selected date range.
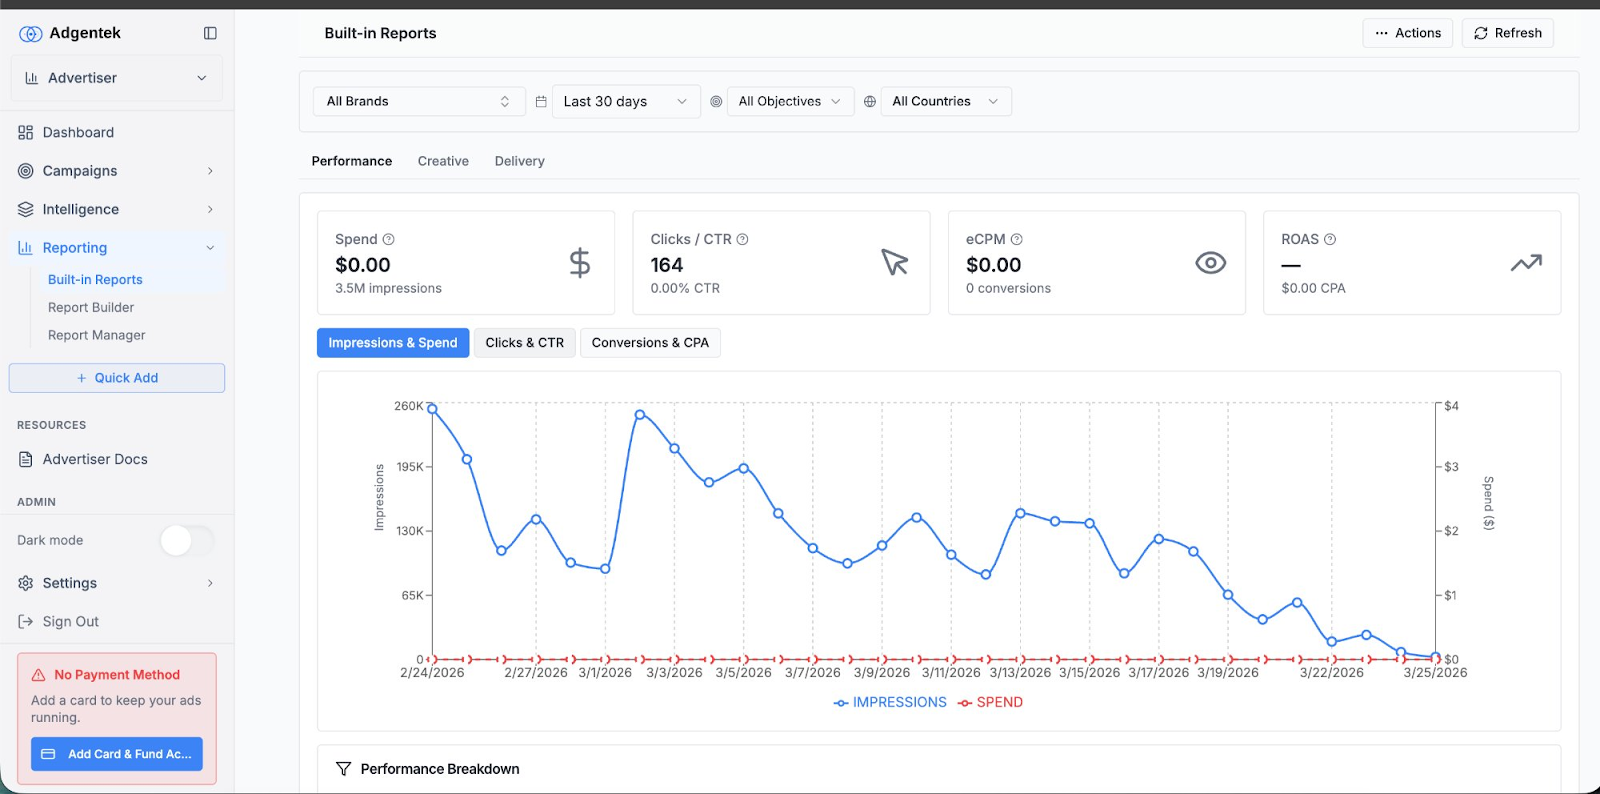
Built-in Reports — Performance overview with KPI summary cards and trend chart.
Filters
At the top of the Built-in Reports page, you can narrow your data using the following filters:
- Brand: Select a specific brand or view all brands.
- Date Range: Choose a preset range such as Last 30 Days, or set a custom range.
- Objective: Filter by campaign objective (e.g., awareness, conversions).
- Country: Filter performance data by geographic region.
KPI Summary Cards
Below the filters, four summary cards display your key performance indicators:
- Spend: Total ad spend and total impressions delivered.
- Clicks / CTR: Total clicks and click-through rate.
- eCPM: Effective cost per thousand impressions and total conversions.
- ROAS: Return on ad spend and cost per acquisition.
Trend Chart
The interactive time-series chart visualizes your performance over the selected date range. You can toggle between three chart views using the buttons above the chart:
- Impressions & Spend
- Clicks & CTR
- Conversions & CPA
Performance Breakdown Table
Below the chart, the Performance Breakdown section provides a detailed tabular view of your data. You can switch between breakdown views using the tabs:
- Campaign: Performance grouped by campaign name.
- Ad: Performance grouped by individual ad.
- Creative: Performance grouped by creative asset.
- Property: Performance grouped by publisher property.
Each row in the table shows Impressions, Clicks, CTR, Spend, CPC, and ROAS for the selected dimension. Use the search field to filter rows, and click Export CSV to download the data.
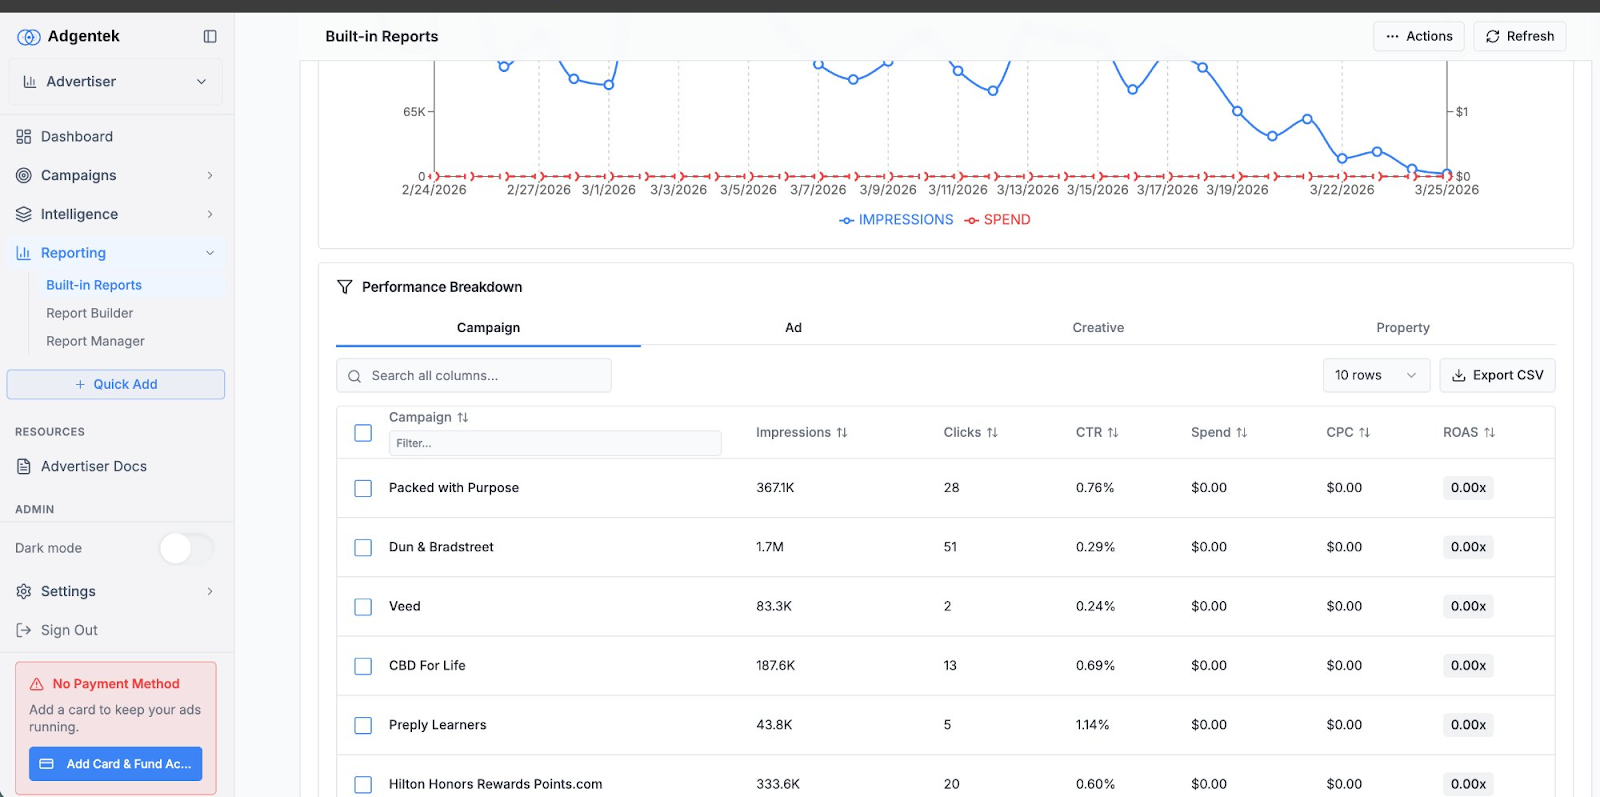
Performance Breakdown table with Campaign-level metrics and Export CSV option.
Report Builder
The Report Builder lets you create custom reports with up to three breakdown dimensions and your choice of metrics. Use it to build reports tailored to your specific analysis needs.
Creating a Custom Report
- Navigate to Reporting > Report Builder in the left menu.
- Enter a Report Name (required) and an optional Description.
- Select up to 3 Breakdown Keys to define how your data is grouped.
- Check the Metrics you want included in the report.
- Set your Filters (brand, date range, objective, and country) in the top-right panel.
- Click Run Preview to see a preview of your report, or click Save to save it for later.
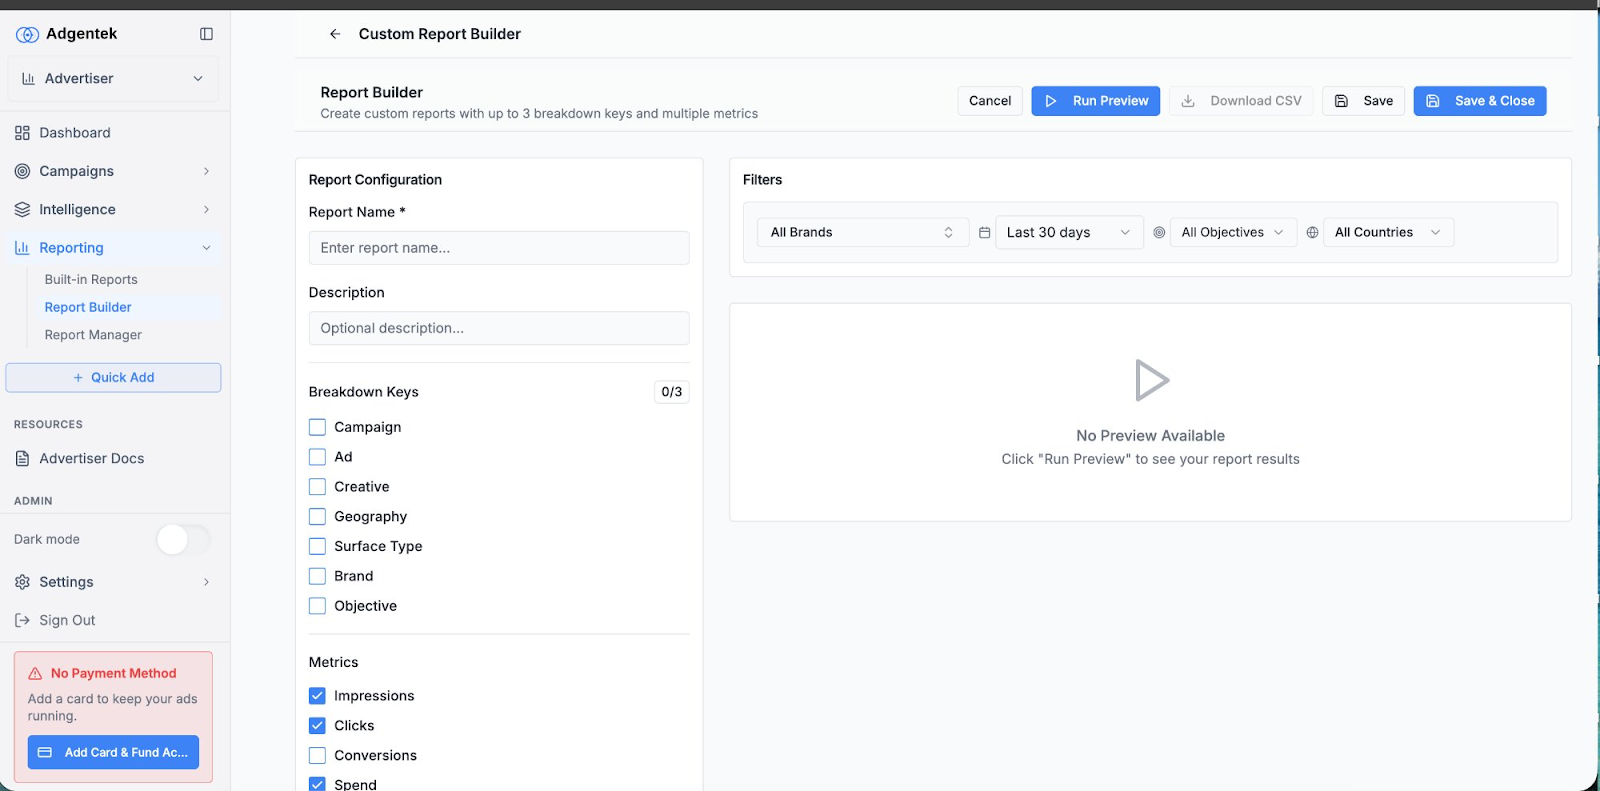
Report Builder — Configure report name, breakdown keys, metrics, and filters.
Breakdown Keys
Breakdown keys determine how your report data is organized. You can select up to three from the following options: Campaign, Ad, Creative, Geography, Surface Type, Brand, and Objective.
Available Metrics
Choose which performance metrics to include in your report. Options include: Impressions, Clicks, Conversions, Spend, Revenue, CTR, and CPC. Impressions, Clicks, and Spend are selected by default.
Filters
Use the filter bar at the top of the right panel to scope your report to a specific brand, time period, campaign objective, or country.
Report Actions
The toolbar at the top of the Report Builder provides the following actions:
- Run Preview: Generate a live preview of the report in the right panel.
- Download CSV: Export the report data as a CSV file.
- Save: Save the report configuration without closing the builder.
- Save & Close: Save the report and return to the Report Manager.
Scheduling Reports
You can schedule any saved report to be delivered automatically via email on a recurring basis. This is ideal for stakeholders who need regular performance updates without logging in to the platform.
How to Schedule a Report
- Open a report in the Report Builder (create a new one or edit an existing one).
- Click the Schedule button at the bottom of the page to open the Schedule Report dialog.
- Configure your schedule settings (see options below).
- Click Save & Schedule to activate the scheduled report.
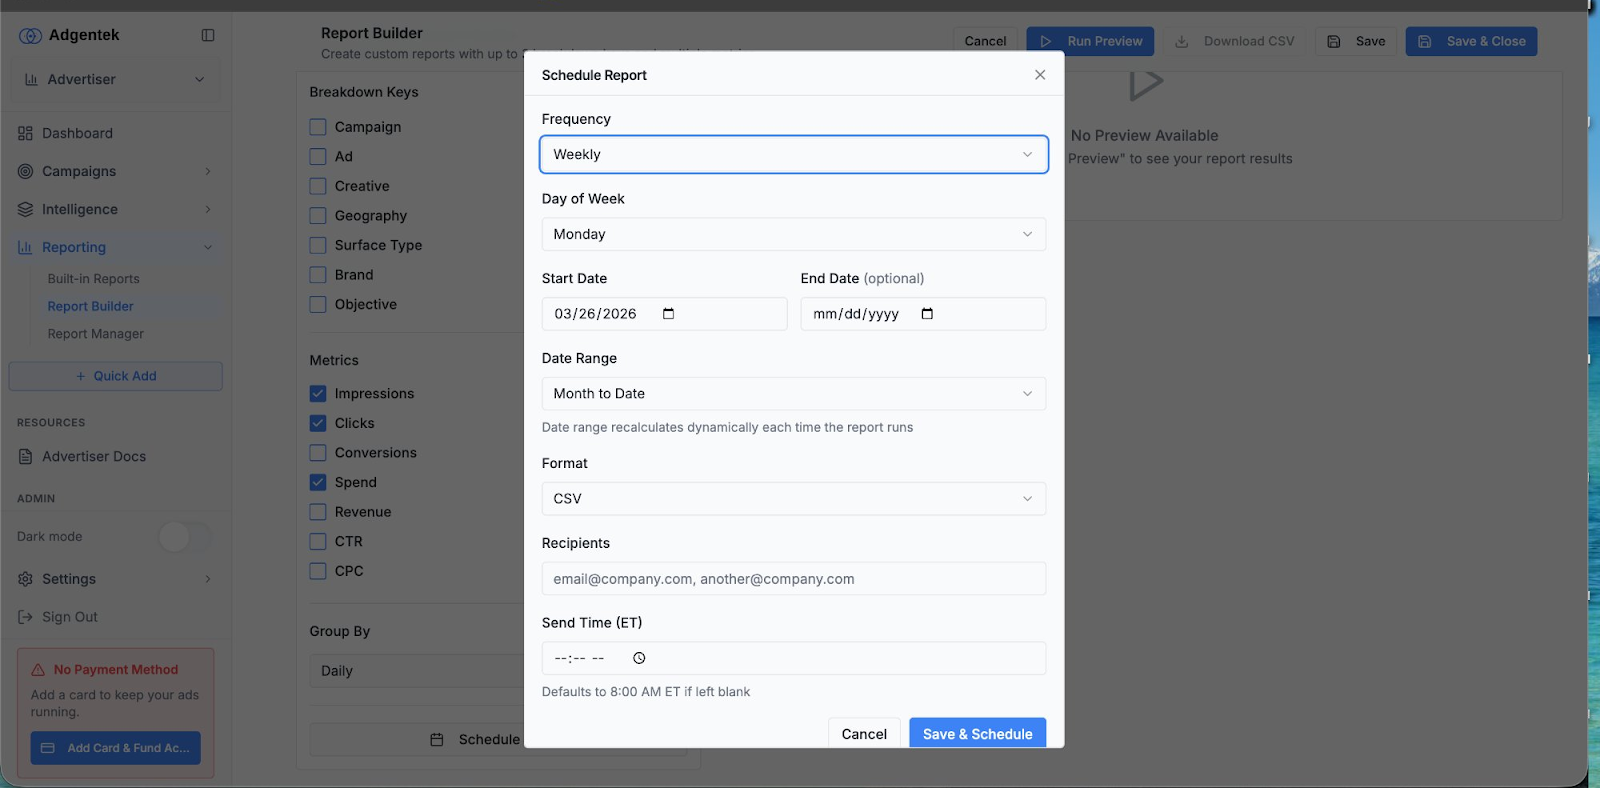
Schedule Report dialog — Configure frequency, recipients, and delivery options.
Schedule Options
- Frequency: Choose how often the report runs — options include Weekly or other available intervals.
- Day of Week: Select which day the report should be generated and sent (e.g., Monday).
- Start Date / End Date: Define when the schedule begins. The end date is optional — leave it blank for ongoing delivery.
- Date Range: Set the data window for each report run (e.g., Month to Date). This recalculates dynamically each time the report runs.
- Format: Select the file format for the report attachment (e.g., CSV).
- Recipients: Enter one or more email addresses (comma-separated) to receive the scheduled report.
- Send Time (ET): Set a specific delivery time in Eastern Time. Defaults to 8:00 AM ET if left blank.
Report Manager
The Report Manager is your central hub for all saved reports. From here you can view, edit, download, share, and delete your custom reports.
Accessing the Report Manager
Navigate to Reporting > Report Manager in the left menu. You will see a list of all your saved reports with the following details:
- Name: The title of the saved report.
- Schedule: Indicates whether the report is scheduled or not.
- Last Run: The date the report was last generated.
- Created: The date the report was originally created.
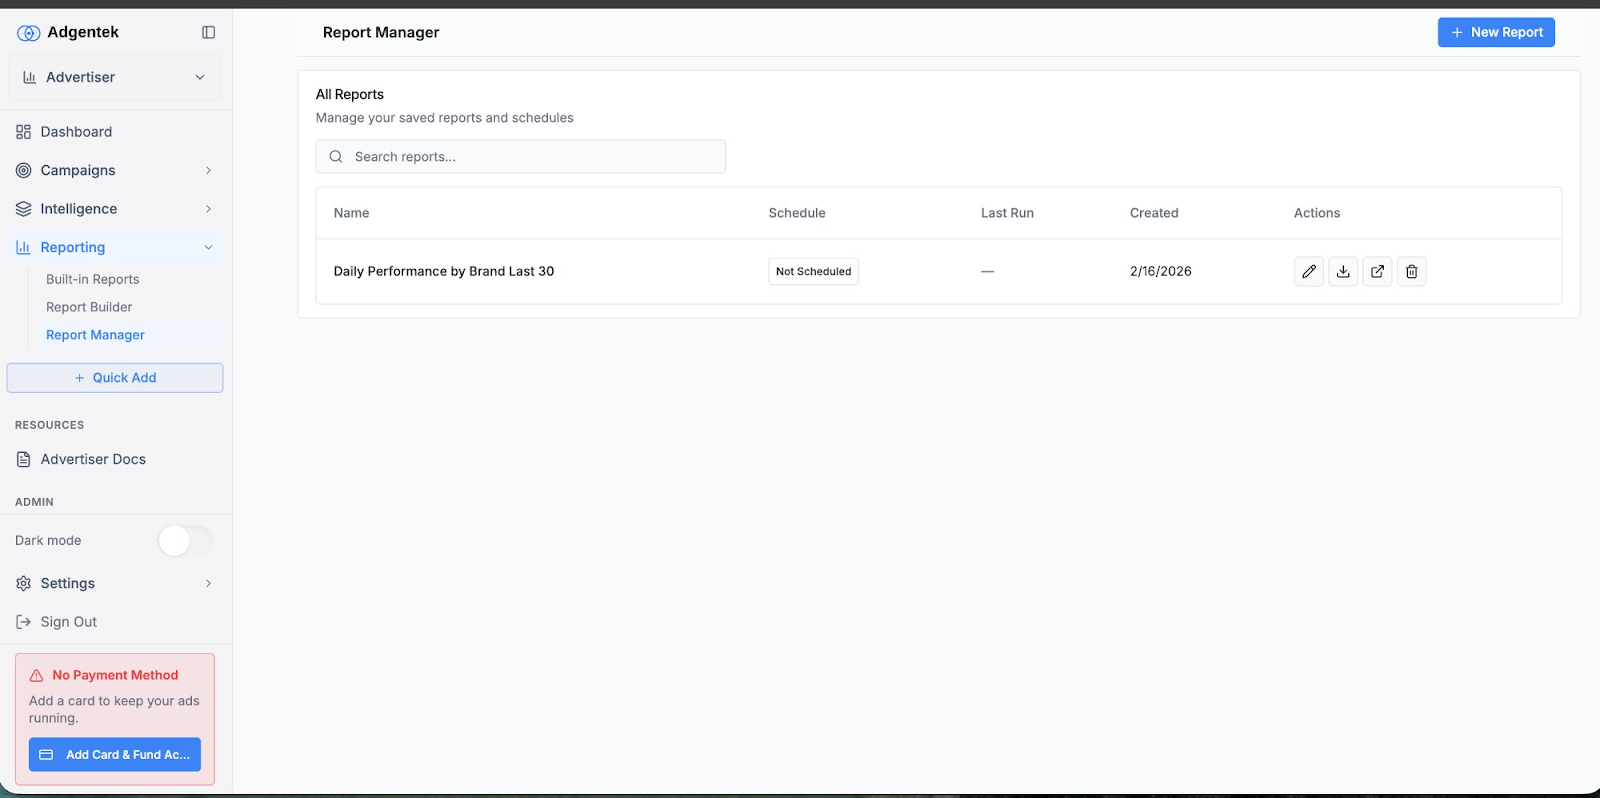
Report Manager — View, edit, download, share, or delete saved reports.
Report Actions
Each report in the manager has an actions column with the following options:
- Edit (pencil icon): Open the report in the Report Builder to modify its configuration.
- Download (arrow icon): Download the report data as a file.
- Share (external link icon): Share the report with others.
- Delete (trash icon): Permanently remove the report.
You can also use the search bar at the top of the page to quickly find a specific report by name.
Creating a New Report
To create a new report directly from the Report Manager, click the + New Report button in the top-right corner. This will open the Report Builder with a blank configuration.
Tips & Best Practices
- Use the Built-in Reports dashboard for quick, day-to-day performance checks across all campaigns.
- Use the Report Builder when you need to drill down into specific dimensions or combine multiple breakdown keys.
- Schedule weekly reports for key stakeholders so they receive consistent updates without needing platform access.
- Save frequently-used report configurations to avoid rebuilding them each time.
- Use the Group By setting (found below the metrics in Report Builder) to set your data grouping interval, such as Daily.
- When scheduling, use the Month to Date date range for reports that should always reflect the current month’s performance.
Need Help?
If you have questions or run into issues with reporting, contact your Adgentek account representative or reach out to support for assistance.